The $20 Million Roster Club: What College Basketball’s NIL Valuations Really Mean

Updated: 2 days ago
NIL INTELLIGENCE
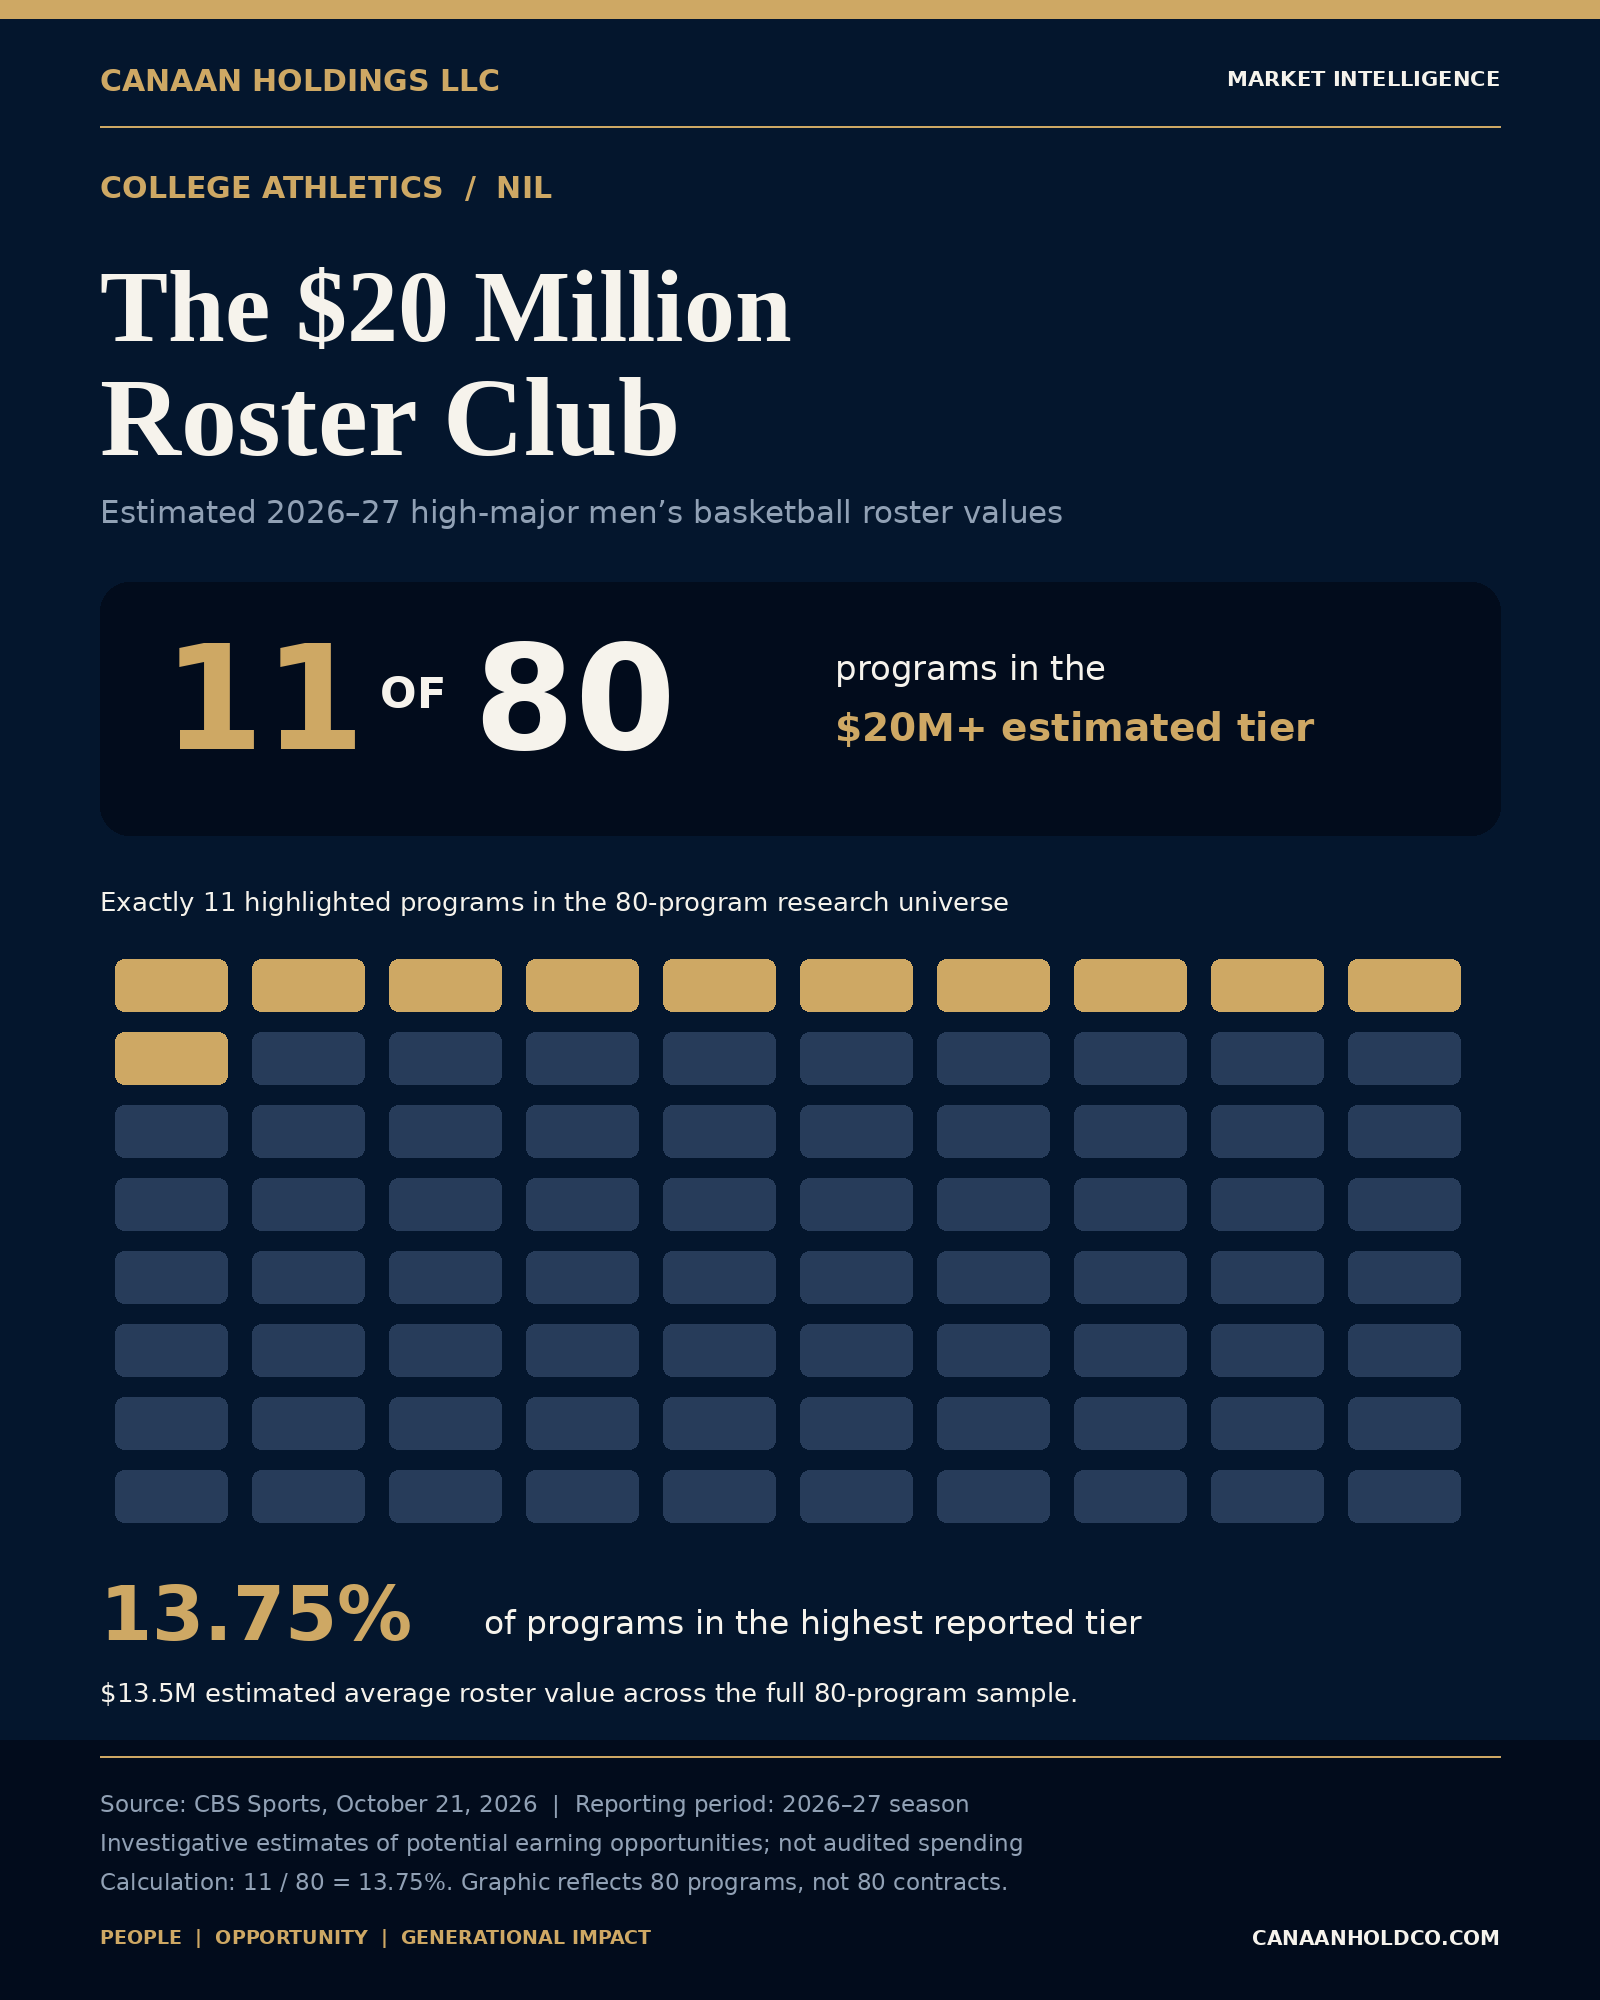
Eleven high-major men's basketball programs now occupy an estimated $20 million-plus roster-value tier for 2026–27.
By Marcus Coleman, CFP® · Canaan Holdings LLC · PHILADELPHIA · October 26, 2026 · 4 min read
CANAAN HOLDINGS LLC | NIL & COLLEGE ATHLETICS INTELLIGENCE | OCTOBER 26, 2026
Eleven high-major men's basketball programs now occupy an estimated $20 million-plus roster-value tier for 2026–27. But there is an important distinction: maximum potential compensation is not the same as money paid, and an expensive roster is not proof of an effective investment.

The numbers behind the headline
An October 21, 2026 CBS Sports investigation by Matt Norlander and Isaac Trotter estimated the average 2026–27 roster at approximately $13.5 million across 80 high-major programs: 79 Power Five programs and Gonzaga. Eleven programs were placed in the $20 million-plus tier.
That represents 13.75% of the covered programs, with the other 69 programs distributed across six lower tiers.
The eleven programs in that top tier are:
Duke
Florida
Kentucky
Illinois
Louisville
Michigan
North Carolina
St. John's
Tennessee
Texas
and Texas Tech
CBS based its work on interviews with more than 100 sources, including coaches, administrators, agents, and other industry participants. These are journalistic estimates, not audited university financial statements.
Why roster 'value' and cash expenditures are different
The methodology assumes players pursuing an additional ELIGIBILITY year remain eligible. It can also include contractual incentives that may only become payable if conditions are satisfied.
Some schools could therefore shift between tiers as legal cases, roster decisions, or bonus outcomes change. The estimates are best read as maximum projected earning opportunities for a particular snapshot in time, not guaranteed payments or a cash ledger.
CBS described a typical high-major roster estimate closer to $7 million a year earlier, but that older estimate and the new exercise should not be treated as a consistently audited time series. The direction of the market is notable; an exact industrywide growth rate is less defensible.
The financial question: what does a program receive for its commitments?
A high roster VALUATION may strengthen a program's ability to recruit and retain talent, but investment effectiveness requires evaluating outcomes against the commitments and their timing.
Universities and athletic departments should examine total fixed and contingent compensation, player availability, retention, contribution to team performance, and the cost of replacing departing talent.
An analytically sound roster-efficiency model would also account for conference strength, injury and eligibility uncertainty, development, coaching quality, and academic or operational constraints.
A simple dollars-per-win ranking would be incomplete, and these estimates alone cannot establish causation between spending and performance.
What athletes and representatives should review
Guaranteed consideration versus contingent bonuses and performance incentives.
The payment schedule, approval or clearance contingencies, and consequences of eligibility changes.
Who receives and controls LICENSING, ENDORSEMENT, content, and related intellectual-property rights.
Tax obligations, cash-flow planning, representation fees, and reserves for delayed or disputed receipts.
What happens after a transfer, termination, injury, or contract dispute.
Canaan's perspective: strategy follows structure
College sports compensation is moving from an informal marketplace toward a larger set of structured financial obligations.
Athlete representatives need disciplined agreement review; schools need clear capital-allocation frameworks; and athlete entrepreneurs need dependable accounting, reserves, and commercial-rights documentation. The headline number is only the beginning of the analysis.
This article extends Canaan's October 24 discussion of college sports compensation by focusing specifically on roster-value estimates and the difference between financial commitments and realized expenditures.
SOURCES
Calculations: 11 ÷ 80 = 13.75%; 80 − 11 = 69. Scope: 2026–27 estimated maximum roster earning opportunities across 80 identified programs.
Figures are third-party estimates subject to contingencies and revision. They are not evidence of actual athlete payments.
CALL TO ACTION
Athletes and families: book an Athlete Representation Consultation at https://www.canaanholdco.com/booking-calendar/athlete-representation-consultation-1
A high roster VALUATION may strengthen a program's ability to recruit and retain talent, but investment effectiveness requires evaluating outcomes against the commitments and their timing.
RELATED READING
Educational research only. This analysis is not individualized legal, tax, or investment advice.
ABOUT THE AUTHOR
Marcus Coleman, CFP® is the Founder and CEO of Canaan Holdings LLC, a Philadelphia-based holding company operating Canaan Business Advisory, Canaan Sports Management, and Canaan Family & Talent Services. STRATEGY FOLLOWS STRUCTURE. PEOPLE | OPPORTUNITY | GENERATIONAL IMPACT.
DISCLOSURE
Educational information only. Not financial, tax, or legal advice. Canaan Holdings LLC.

Comments